Bitcoin's $74K Rally Divides Traders: Bull Trap or New Beginning?
Traders remain split on Bitcoin's future direction after its climb to $74,000, with conflicting views on whether the cryptocurrency has truly bottomed out.

Bitcoin (BTC) was changing hands 4.5% beneath the $74,000 peak that was achieved on Thursday, leaving market participants divided about whether this price point could represent a local ceiling for BTC's valuation.
Key takeaways:
- Technical patterns in Bitcoin's price action continue to mirror the 2022 bear market phase, indicating a potential additional decline beneath $60,000 remains on the table.
- Contrarian voices maintain that the bottom has been established and anticipate a breakout surge toward the $75,000–$80,000 range as the next major move.
Is the 2022 BTC price cycle repeating?
The current technical framework of BTC, subsequent to its most recent bounce from the $60,000 level, displays notable parallels with the mid-phase of previous bear market cycles.
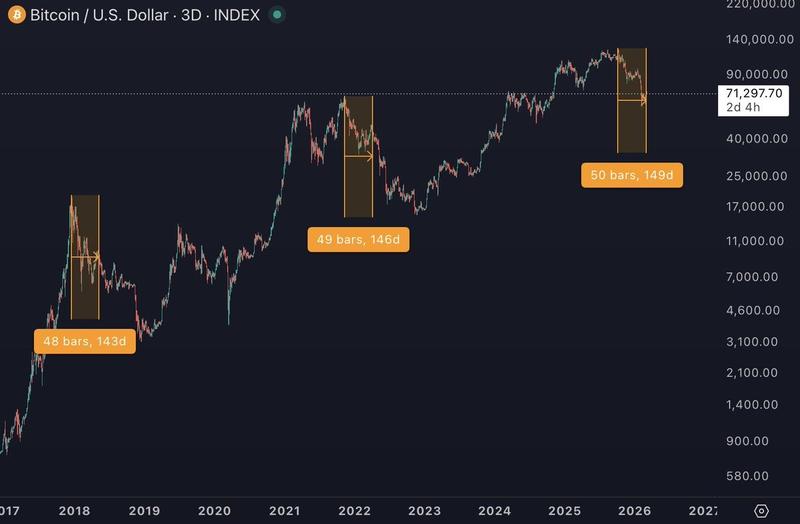
The recent ascent of Bitcoin to $74,000 occurred 149 days following its bull cycle apex of $126,000 that was registered in October 2025.
"$BTC made a local high around 140–150 days after its all-time high in the previous two cycles before pushing lower," said analyst Bitcoin Hyper in an X post on Thursday.
Supporting this perspective, pseudonymous trader Bitcoin Isaiah characterized the climb to $74,000 as a "perfect local top indicator," highlighting that premature optimism from bullish traders serves as a warning sign for additional selling pressure ahead.
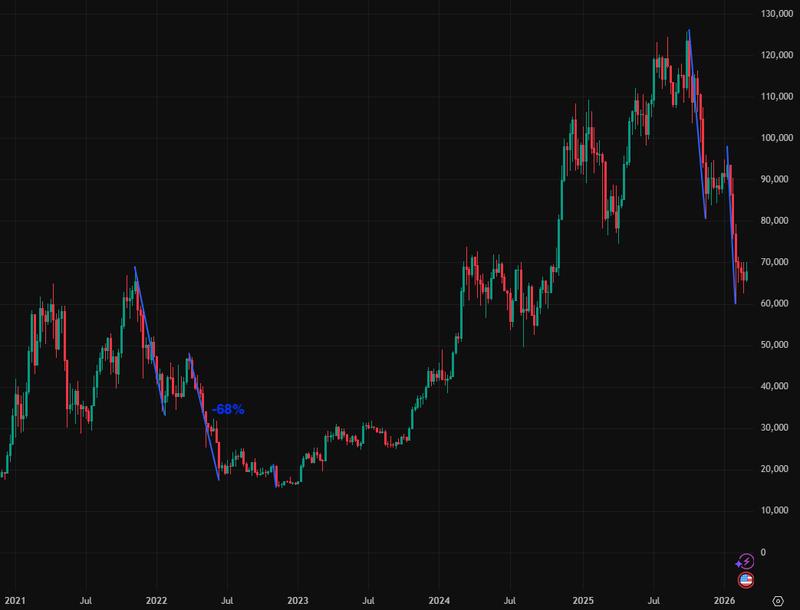
The analyst made reference to the 2022 market cycle, during which comparable euphoric sentiment came before a devastating 68% plunge from $48,200 down to $15,500, raising the possibility that historical patterns might replicate themselves with a return to price levels below $60,000.
Master of Crypto stated that the temporary surge beyond $70,000 represented a liquidity trap, eliminating both short and long positions before setting sights on lower price zones spanning $62,000-$65,000 where greater ask-orders are positioned, adding:
"The price usually goes where the bigger money sits."
According to Cointelegraph's coverage, indications of a potential pullback surfaced this week following the push to $74,000, specifically a traditional bearish chart formation and substantial overhead resistance levels.
Is Bitcoin's relief rally over?
The optimistic camp, in contrast, maintains that $60,000 likely represented the market floor, signaling a fundamental change in structure.
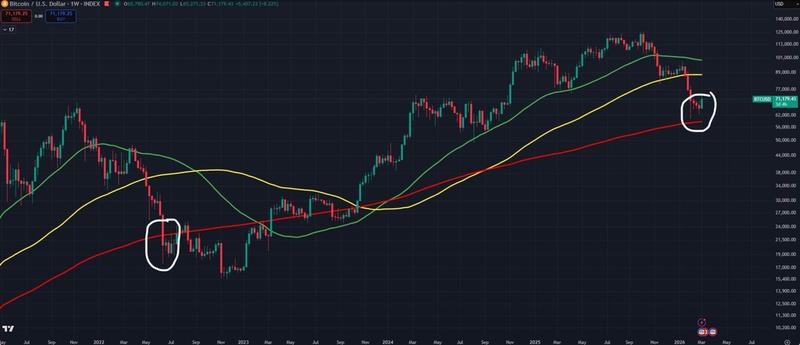
For example, crypto analyst Bitcoin Munger stated the 2022 Bitcoin bear fractal was not a "reason to be bearish" because this cycle is different.
A chart included with his analysis demonstrated that whereas the 2022 downturn witnessed the price "cut through" the 200-week exponential moving average (EMA), the current cycle merely retested the trend line and bounced.
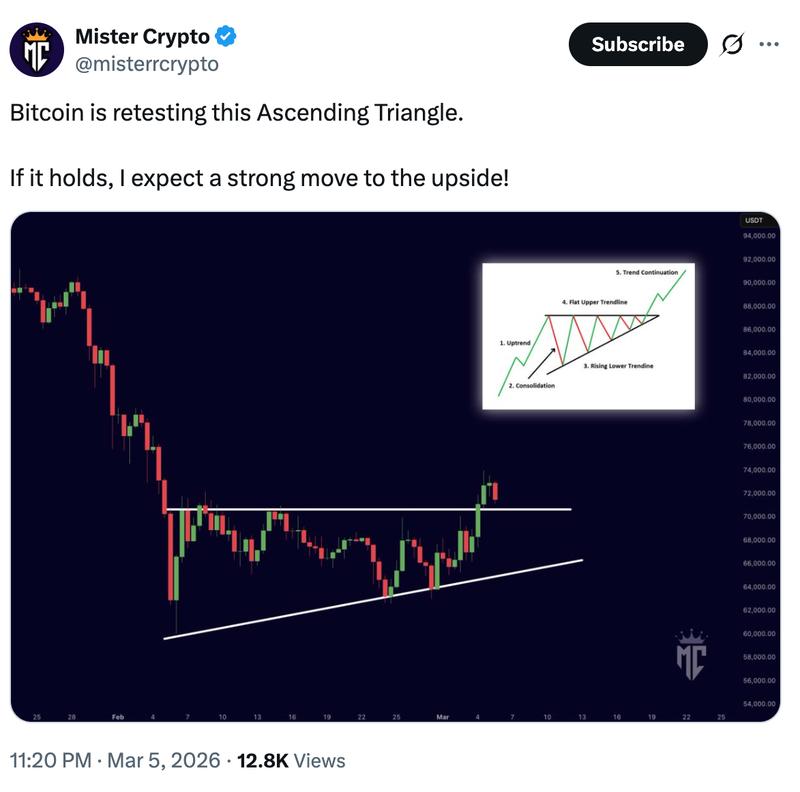
In the meantime, analyst Mister Crypto indicates the BTC/USD pair is completing a breakout from an ascending triangle pattern with anticipation of a "strong move to the upside," provided the upper trend line at $70,000 maintains its role as support.
Additional distinctions from the 2022 cycle encompass robust institutional ETF inflows and increasingly constrained supply dynamics, which could potentially shield Bitcoin from experiencing another major crash and position it favorably for a rally targeting the $75,000-$80,000 price range.